
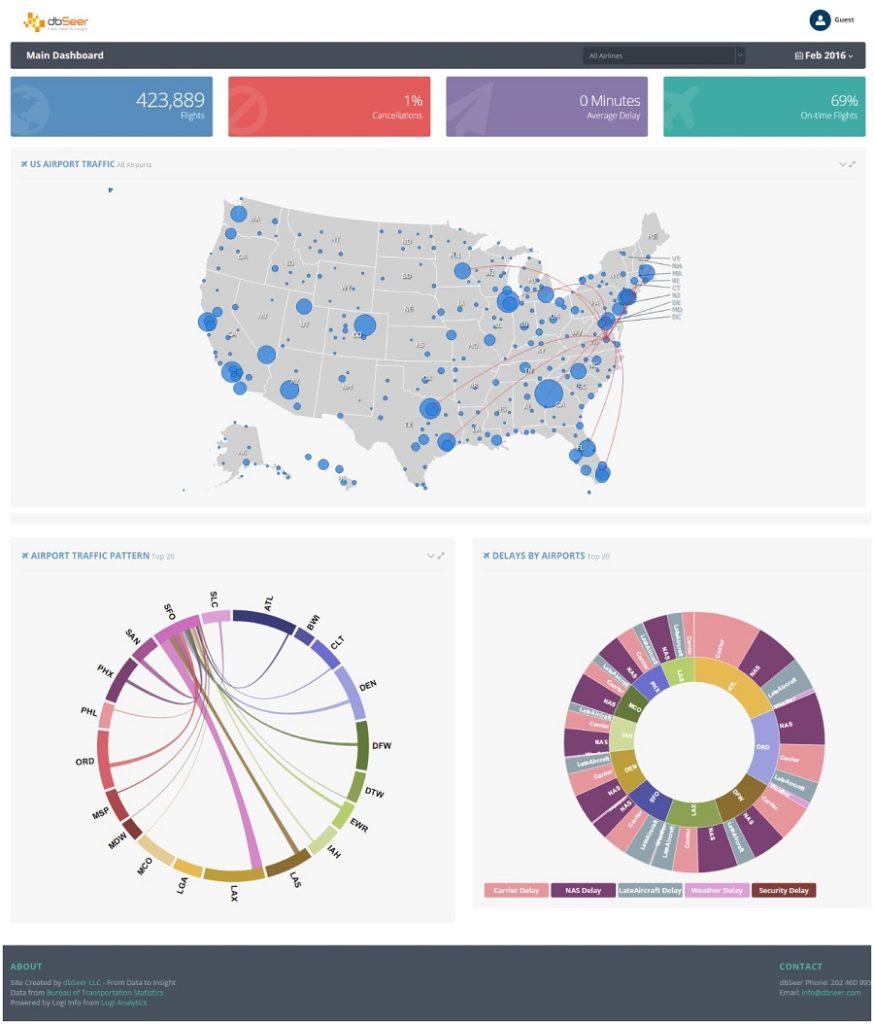
Aviation
Dig deeper into data without losing perspective, and maybe improve the chances of your next flight taking off and landing on time.
Our Aviation Dashboard illustrates the kind of visibility you should expect from your data platform.
We’ve put together the on-time and flight pattern data for US airports in visual form, integrating chart types that best guide you through the data, and illustrate how visualizations can function as both analysis and navigation tools.
Drill all the way down to the table data, and then create your own visualizations using the filter, formula, and charting tools from Logi Analytics self-service reporting module.
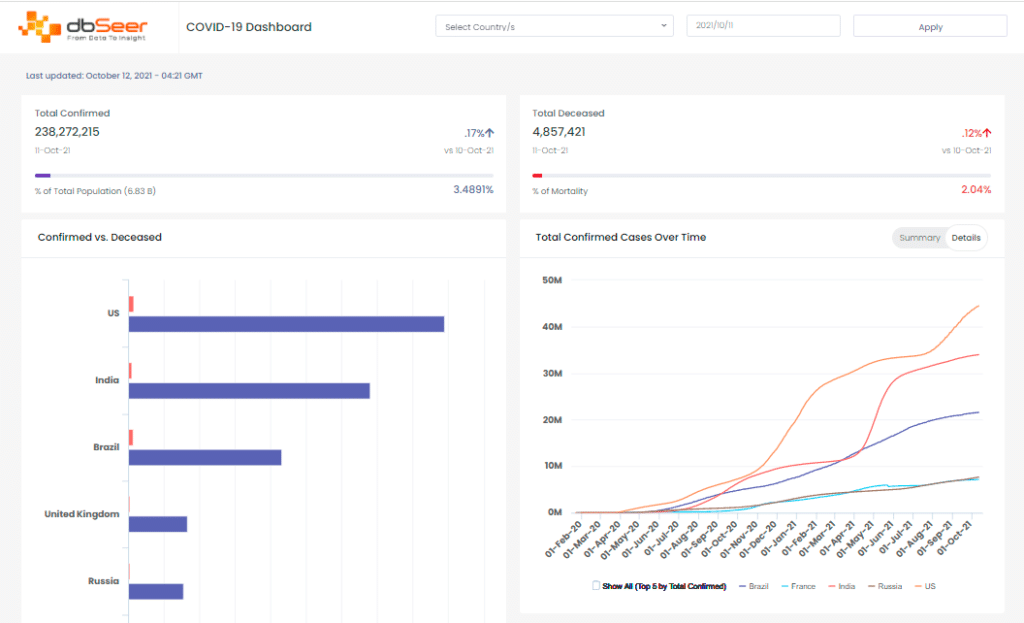
Covid
A global pandemic that has changed a generation and created an era. In all the uncertainty, as we hope for the end of the spread of this disease, the team at dbSeer decided to do what we do best.
Country by country, we are tracking confirmed cases and fatalities to help understand the course of the pandemic over time.
Feel free to check the page daily for the most accurate data. dbSeer hopes everyone is staying healthy and safe during this time.